Motivation
In the realm of finance, the generation of returns is invariably linked to the embrace of risk, but there are consequences: bonds can default, markets can crash, startups can go bankrupt, and hedge-funds can blow up. When considering a new financial product, investors have to think long and hard as to whether or not they are adequately compensated for the level of risk they are taking. Family office investors are not only burdened with this task, but also determining how their multitude of investments combine and interact to form a portfolio. The characteristics of the resulting portfolio determines the expected rate of return, volatility, and an associated probability of catastrophic loss - which is never zero.
What’s past is prologue
The risk of catastrophic loss on shorter timescales is relatively modest - the expected max-drawdown of the SP500 over one year is approximately 14%. Unfortunately, the story gets much less rosy if you consider longer timescales. The Great Depression (1929) resulted in an 86% drawdown that took ~28 years to recover. The Great Financial Crisis (2008) entailed a 57% drop that took ~5 years to recover. On Black Monday (1987), the market dropped ~22% in a single day. Looking beyond the US, the Japanese Nikkei index (representing the 225 biggest companies in Japan, the world’s 3rd largest economy) peaked in December 1989 and still hasn’t recovered, after adjusting for inflation and dividends.
Determinating a risk-target
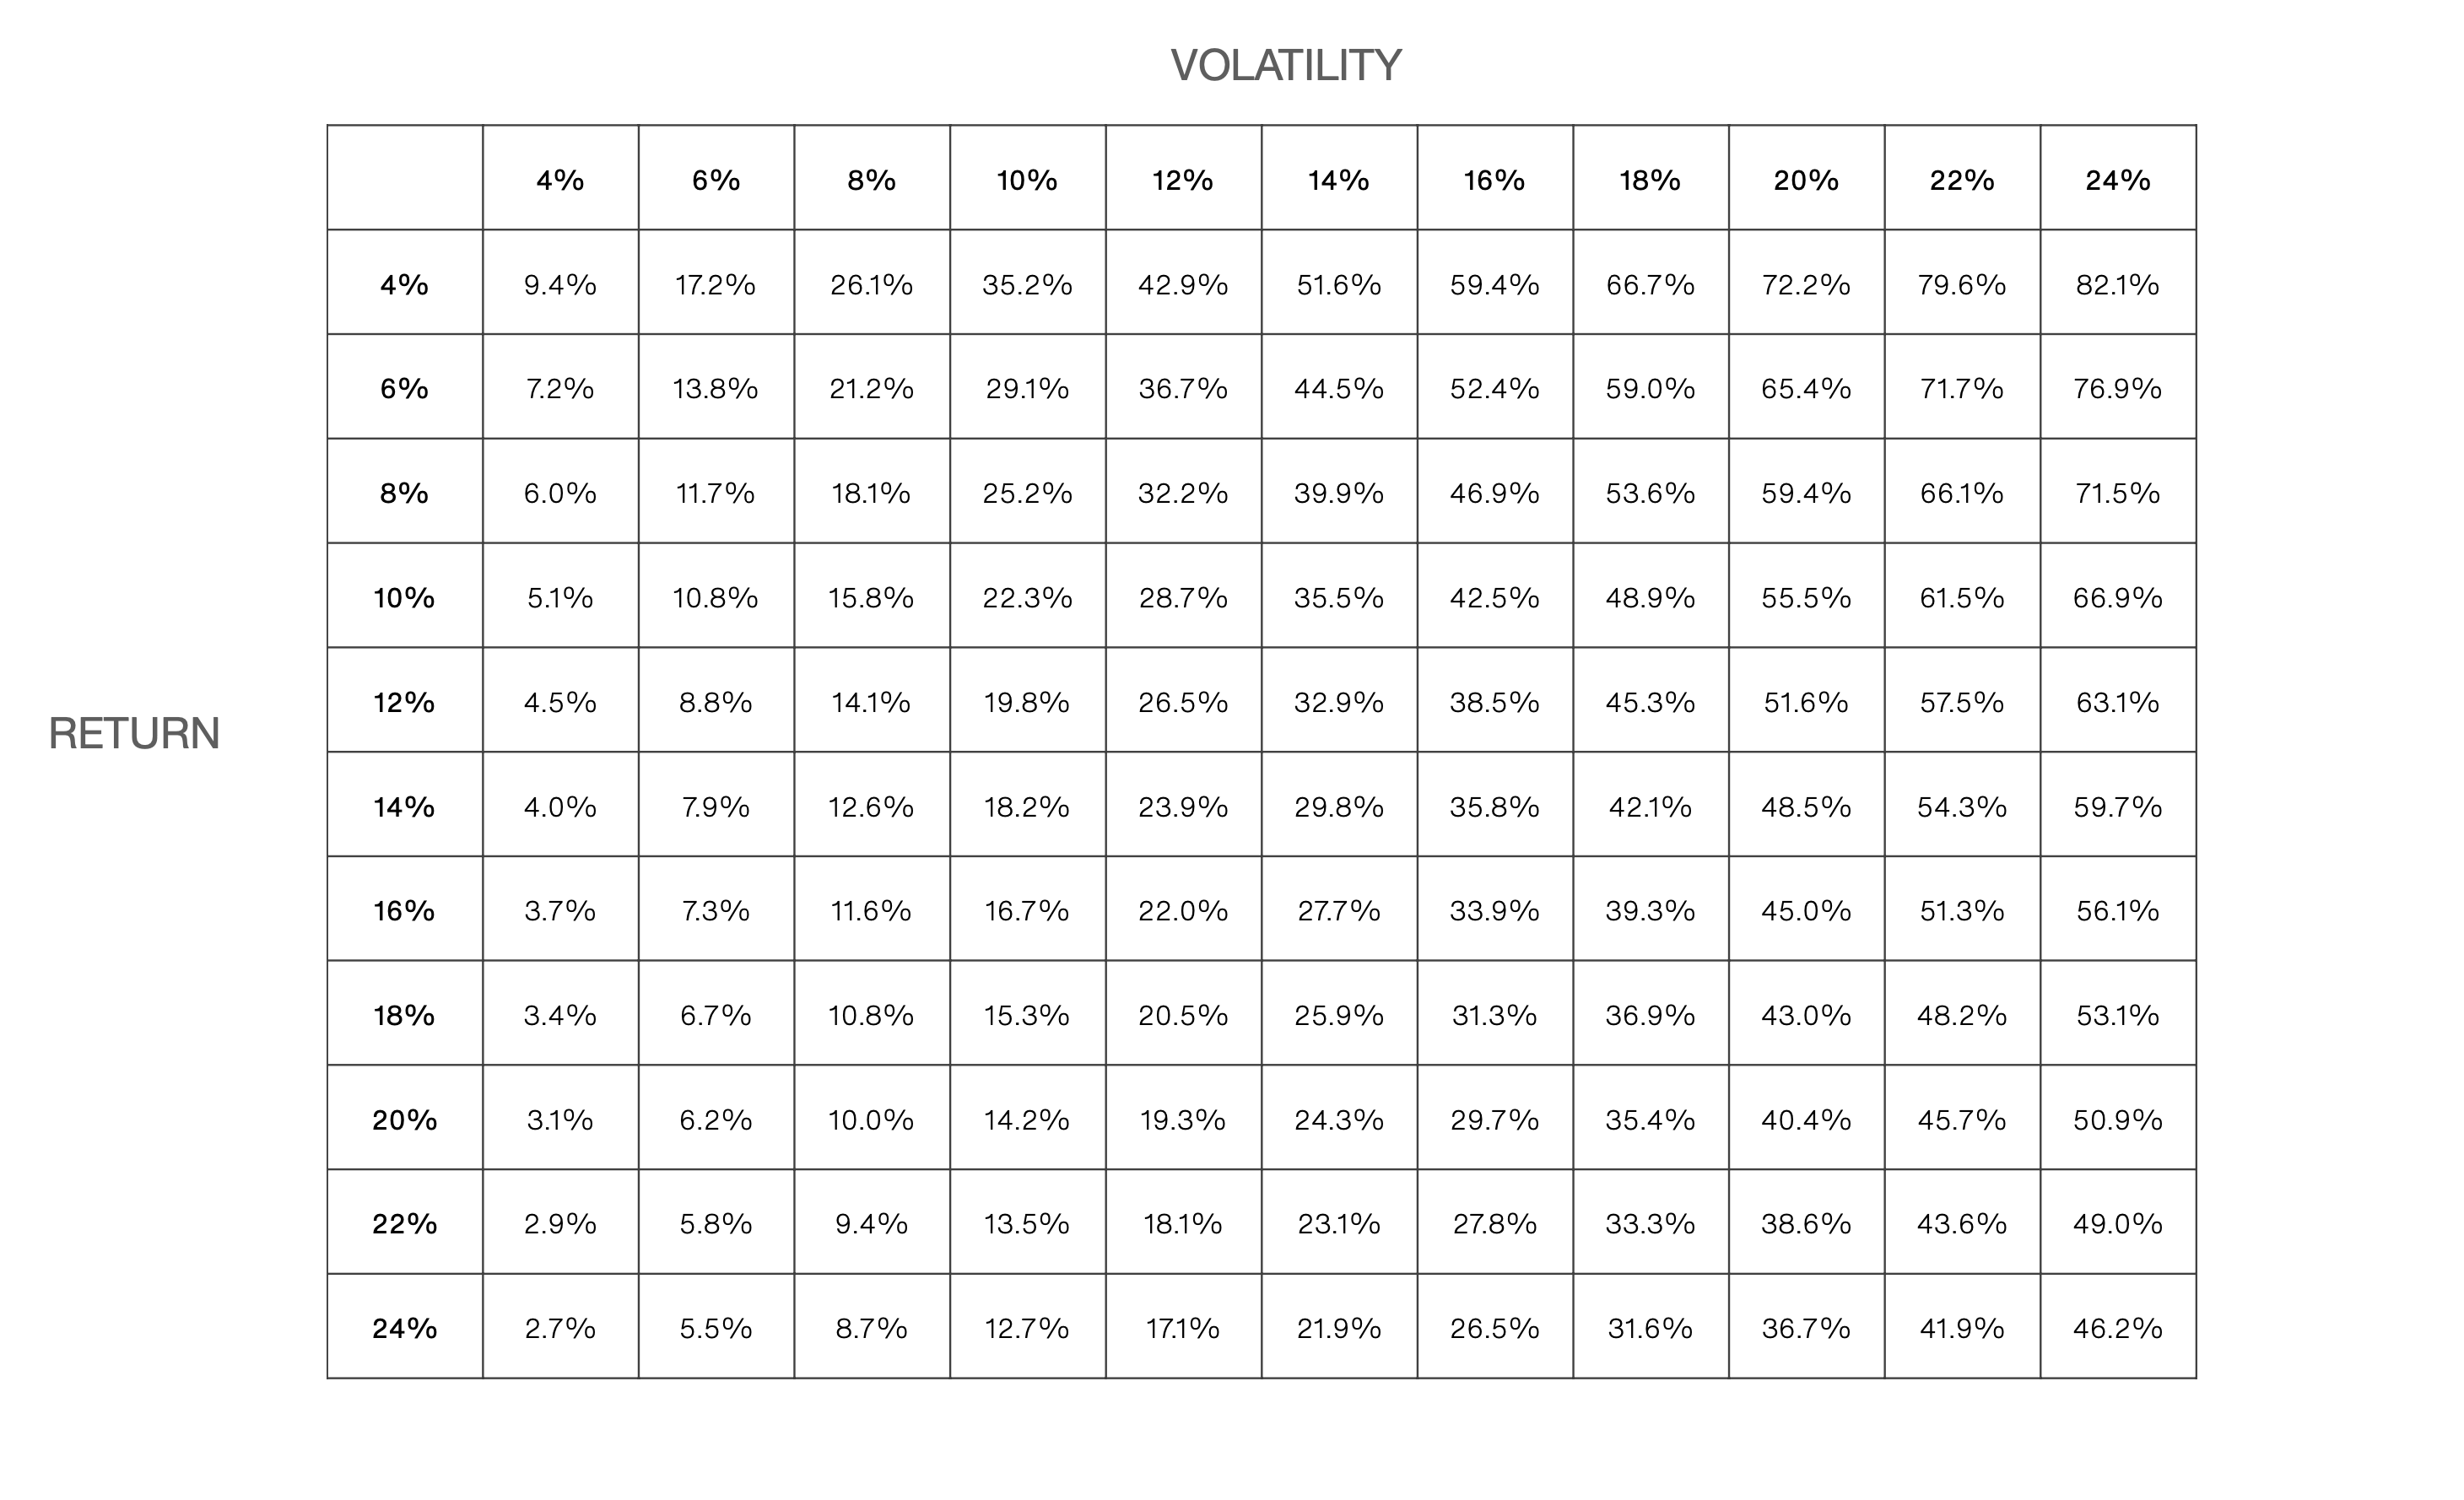
Drawdowns of this magnitude are in our opinion not survivable. In our internal conversations, we think we could survive at most a 35-40% max-drawdown. We don’t want to blow up our office every 50 years. Working backwards from this drawdown limit, we use Monte Carlos to simulate the portfolio characteristics (expected return & volatility) that limit our median 50-year max-drawdown to 35%, subject to a myriad of statistical assumptions. Below is a grid of expected 50-year drawdowns for different pairs of expected return and volatility. Naturally, expected drawdowns are increasing in volatility and decreasing in returns (a portfolio with higher expected returns gets pulled out of a drawdown faster), which matches econometric intuition.
Result
From this grid, we see that we need to target long-run portfolio volatility in the neighborhood of ~14% and achieve annualized returns of 8-12%. We would like to run more aggressively, but we will have to become more efficient risk-takers first.
def func(x: float) -> float:
    return x ** 2